
The sales meeting starts with reassuring numbers. More leads. More meetings. Enough open pipeline to cover the target several times over. Then the CFO asks a short question: “How much of this can we actually count on by the end of the quarter?” The discussion starts over.
A dashboard can show a busy team while concealing a weak commercial position. A large opportunity stays open for months. A proposal has gone out, but the buyer has not agreed on the requirements. Several supposedly new leads belong to companies already talking to sales.
Funnel metrics become useful when each number represents a clearly defined event. Leaders need to see which buyers are moving toward a decision, where time is being lost, and what the team can change. That requires looking beyond the size of the pipeline.
Agree on what actually happened
Consider a hypothetical supplier of warehouse equipment. One rep creates an opportunity whenever a buyer asks for a catalog. Another waits until they have discussed operating requirements, budget, and the project schedule. Both use the same CRM stage, although the evidence of a potential purchase is very different.
Comparing their conversion rates without resolving that difference tells management very little.
Each stage needs an entry rule and evidence that justifies moving forward. A company fits the target segment. A contact confirms a relevant business need. Both sides agree to a technical evaluation. The buyer receives a proposal based on requirements already discussed. These events can be checked against a conversation, an email, or a document.
The unit being counted matters, too. Three contacts at one company may represent a single purchase. Three projects within one corporate group may represent separate opportunities. Counting people at the top and unique companies at the bottom introduces a measurement change that can look like lost demand.
The following map connects five commercial stages with the metrics worth reading together.
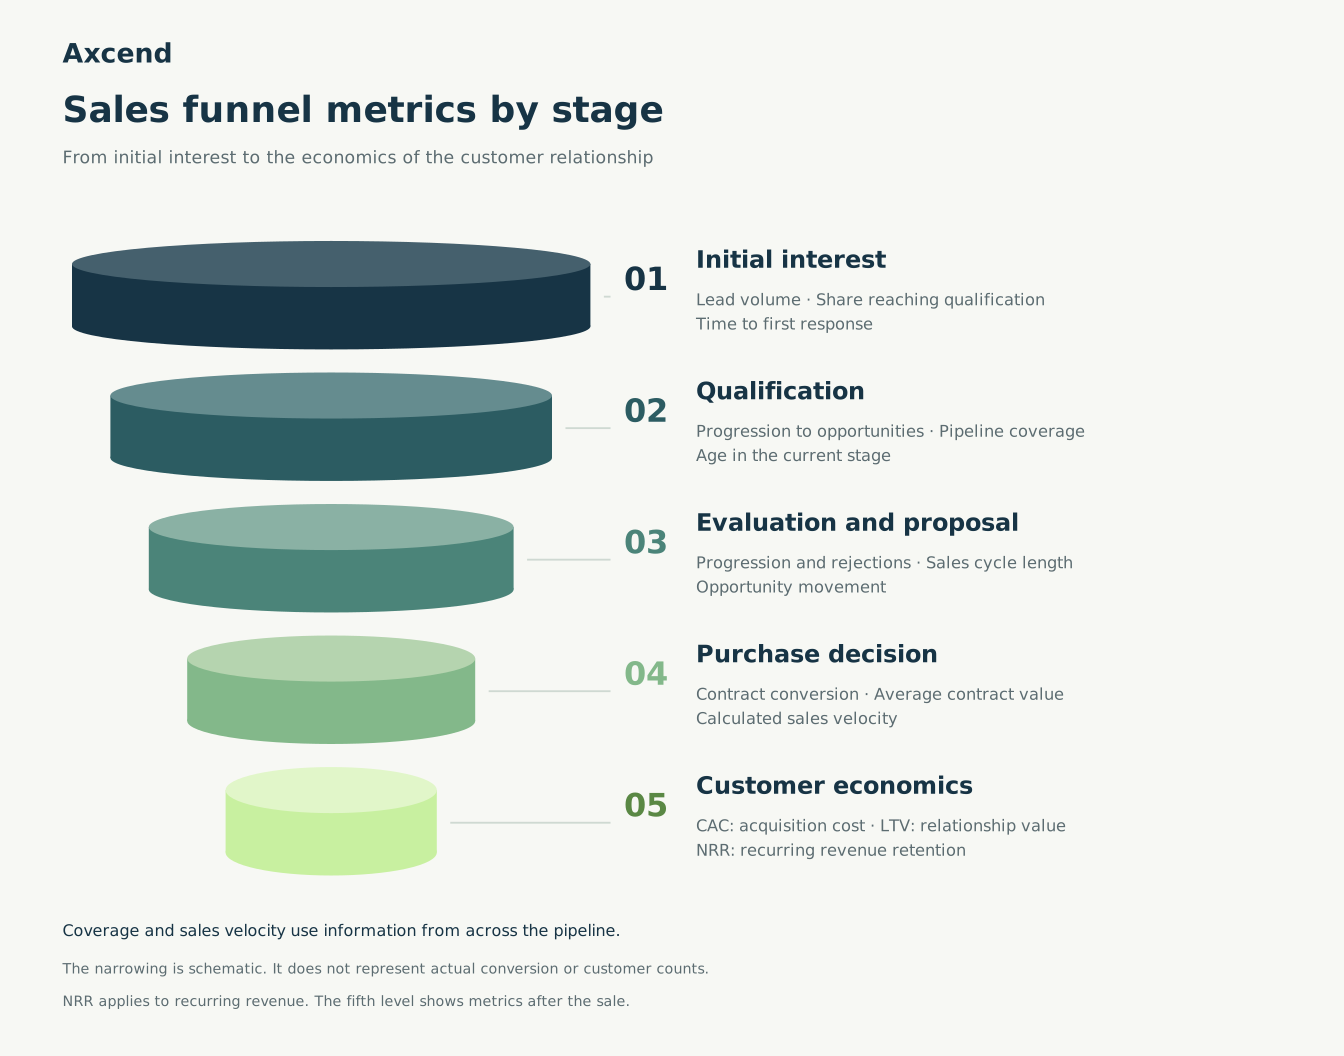
The narrowing is schematic and does not represent actual conversion rates. The fifth level shows metrics after the sale. Metrics spanning the funnel draw on information from several stages.
For Axcend, agreeing on the target customer and the commercial meaning of a first conversation is part of preparing an outreach program. When an external team passes qualified interest to an internal sales team, both sides need the same definition of qualification. Otherwise, the provider can report a completed assignment while the seller receives a conversation that has to begin again.
A percentage needs a clear denominator
Suppose a company receives 100 new inquiries in June and signs 20 contracts that month. Dividing twenty by one hundred does not establish a 20% conversion rate for June leads. Some contracts may come from discussions that began in the spring. Most June buyers may still be evaluating suppliers.
To measure progression, group leads by when they entered the funnel and give each group a comparable observation window. You might compare the share that qualifies within 30 days of arrival. Choose the window for your sales process and label it in the report. HubSpot’s reporting documentation also distinguishes how records pass through stages and how a selected date range affects their inclusion.
The basic stage conversion formula is straightforward: take the members of the starting group who reach the next stage, divide by the original group size, and multiply by 100%. Keeping the population consistent is the harder part.
The share of closed opportunities that result in signed contracts uses a different denominator. Divide opportunities resulting in signed contracts by all opportunities closed, with or without a contract. Open opportunities are excluded from that calculation. But if the question is how much of an original group has ultimately produced sales, open opportunities cannot simply disappear from the analysis. Show how many remain unresolved.
The same distinction matters when discussing opportunities that do not progress. If forty out of one hundred companies progress, the other sixty may include rejections, postponed projects, and ongoing discussions. A 60% nonprogression rate at the reporting date is not necessarily a 60% final rejection rate. Check the statuses and allow an appropriate observation period before classifying those opportunities as closed without a contract.
Time can expose what volume conceals
The warehouse equipment supplier may have plenty of relevant inquiries while its engineers take two weeks to prepare a calculation. Reps keep calling. Buyers keep responding. Proposals still arrive too late. Increasing the advertising budget would add work to the same bottleneck.
For inbound inquiries, measure response time from arrival to the first substantive attempt to contact the prospect. Track an automated acknowledgment separately. The mean is the sum of those waiting intervals divided by the number of inquiries handled. Show the median and the share still waiting for a response alongside it. An average calculated only from handled inquiries leaves the unanswered queue invisible. Outbound prospecting needs its own starting event and measurement rules.
The age of an open opportunity in a stage runs from its latest entry into that stage to the reporting date. That differs from the time spent in a stage by opportunities that have already moved on. The first measure describes the current queue. The second helps explain the normal pace of progression.
Sales cycle length also requires a consistent starting point. Measuring from the first inquiry or from the creation of a qualified opportunity can both be useful, provided the definition stays fixed. For deals with signed contracts, add the elapsed days and divide by the number of those deals. Review open opportunities and those closed without a contract separately so that contracts signed quickly do not hide a long tail of stalled discussions.
Every delay should lead to a practical question: who needs to act next? It might be the rep, an engineer, a lawyer, or the buyer. Identifying that person gives the team something to work on beyond turning a dashboard cell red.
Translate the target into the work required
Take an illustrative target of $2.4 million in new contract bookings, with an average contract value of $40,000. This is the value of signed agreements. Recognized revenue and cash receipts require separate timing assumptions.
The target calls for 60 signed contracts. If 30% of comparable qualified opportunities historically become sales, the team needs 200 opportunities. If half of qualified leads become opportunities, it needs 400 qualified leads. If one in four initial leads qualifies, the starting requirement is 1,600 leads.
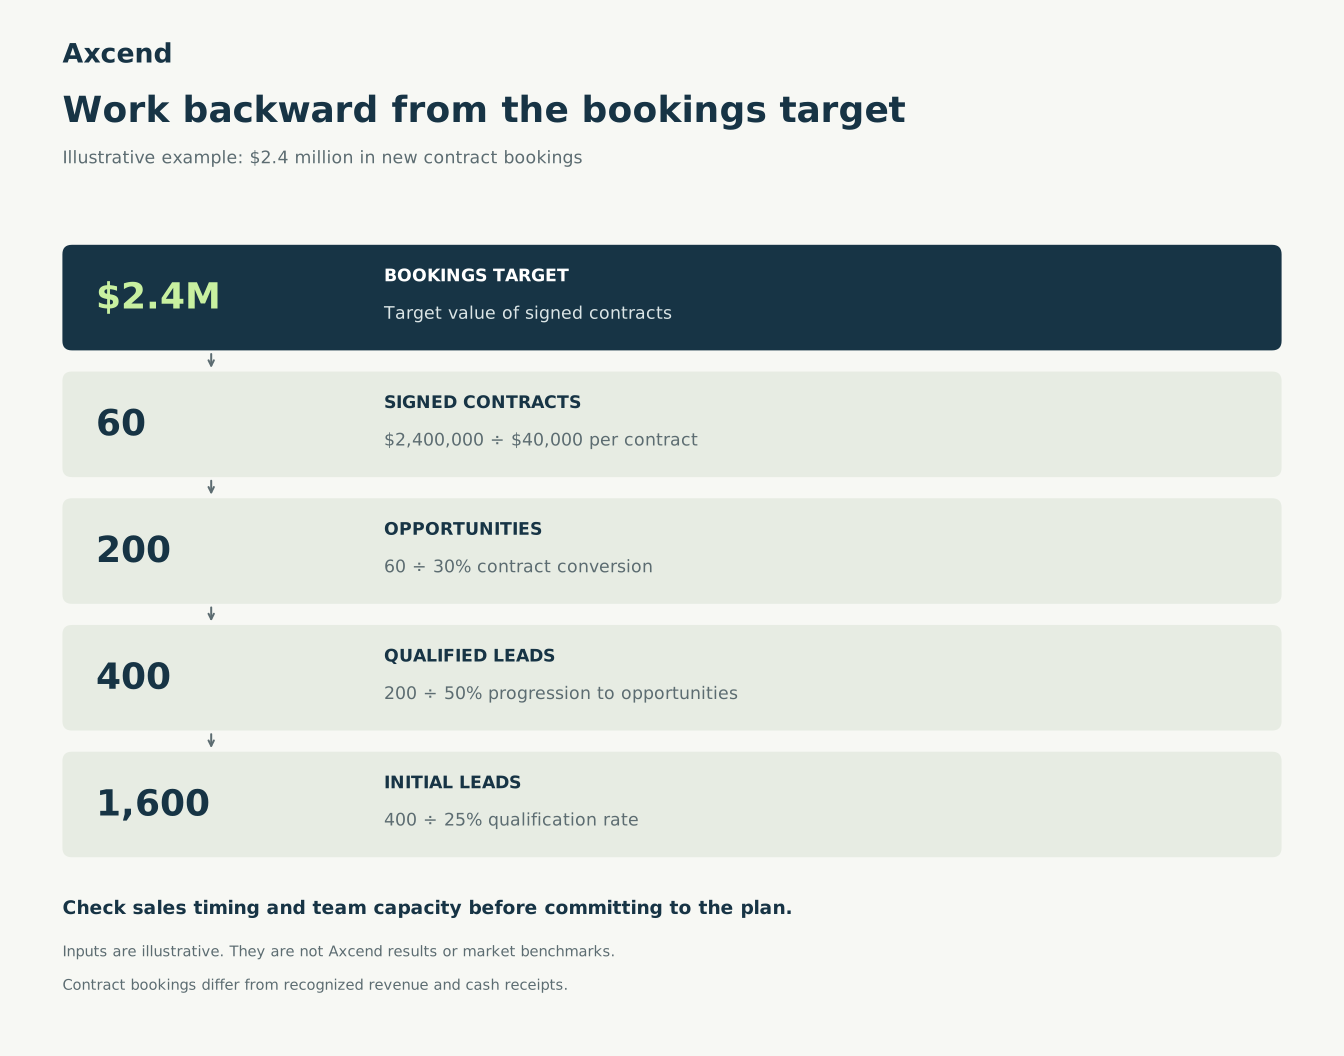
An illustrative Axcend calculation. All inputs were chosen to explain the method. They are not company results or market benchmarks. Conversion assumptions refer to comparable groups with known outcomes.
Now management has a useful planning discussion. Can the team handle 1,600 inquiries? Is there enough engineering capacity to evaluate 200 opportunities? Does the addressable market contain enough suitable companies? Correct arithmetic cannot create demand or add hours to a seller’s week.
The next step is the calendar. If the journey from inquiry to signature normally takes several months, leads generated in the final weeks of a quarter will largely support later periods. Look at the distribution of actual completion times. An average does not promise that every opportunity will close on a specific date.
A large pipeline can still be too small
Suppose the company needs another $600,000 in bookings to reach its target and has $1.8 million in open opportunities. Its coverage of the remaining target is 3:1. The calculation divides open pipeline value by the remaining goal, using the same period and the same basis for contract value.
That sounds comfortable until contract conversion rate enters the discussion. At an assumed 30% conversion rate, the pipeline represents $540,000 in expected contract value. It is already short of the remaining target. Even that simplified calculation assumes the opportunities are comparable and can finish within the relevant period.
Read coverage alongside expected closing dates, stages, deal sizes, and the outcomes of similar opportunities. A pipeline concentrated in a few large contracts is particularly sensitive to individual buyer decisions. One delayed purchase can change the outlook more than dozens of new leads.
Sales velocity provides another combined view. In the formula described by Salesforce, opportunity count is multiplied by average deal value and contract conversion rate, then divided by sales cycle length. When the cycle is measured in days, the result is expressed in dollars per day. It can help compare similar segments and periods. Treat it as a calculated indicator, not a substitute for forecasting specific contracts or cash receipts.
A weak number opens an investigation
A conversion decline across the team may reflect a change in lead sources, a product issue, or approval delays. An individual rep’s weak results also need context. They may have inherited a new territory or a more complex set of projects. One cell in a report is insufficient evidence for a staffing decision.
Return to the equipment supplier. If buyers participate actively in a warehouse assessment but stop responding after the proposal, examine several actual deals. The proposals might contain an incomplete installation estimate, unclear delivery dates, or commitments the customer cannot easily approve. Negotiation coaching will help only with causes the seller can influence.
A useful review ends with a change that can be checked. For example, the engineer and rep agree on the scope of the estimate with the buyer before preparing the proposal. The manager then follows the next group of proposals, considering the number of deals, their characteristics, and the observation period. Two successful sales do not establish a durable improvement.
Measurement should continue after signature. Customer acquisition cost, or CAC, captures the cost of acquiring a new customer. State which expenses are included and account for the delay between spending and sales. Lifetime value, or LTV, estimates the economic value of a customer relationship over a defined horizon. For investment decisions, a model based on gross profit and retention is useful, with its assumptions made explicit.
For businesses with recurring payments, net revenue retention measures the change in recurring revenue from the same customer group, including expansion, contraction, and churn. Revenue from newly acquired customers is excluded, as Stripe explains. A supplier selling equipment through individual transactions will often learn more by tracking repeat purchases, service revenue, and margins separately.
At the next sales meeting, bring one established obstacle, several reviewed deals, and a specific action. That gives the CFO a more useful answer: which part of the target is supported by buyer progress, which part still depends on assumptions, and who will test those assumptions this week.